Heatmap Visualization for SNP-Trait Associations
Source:R/plot_heatmap.R
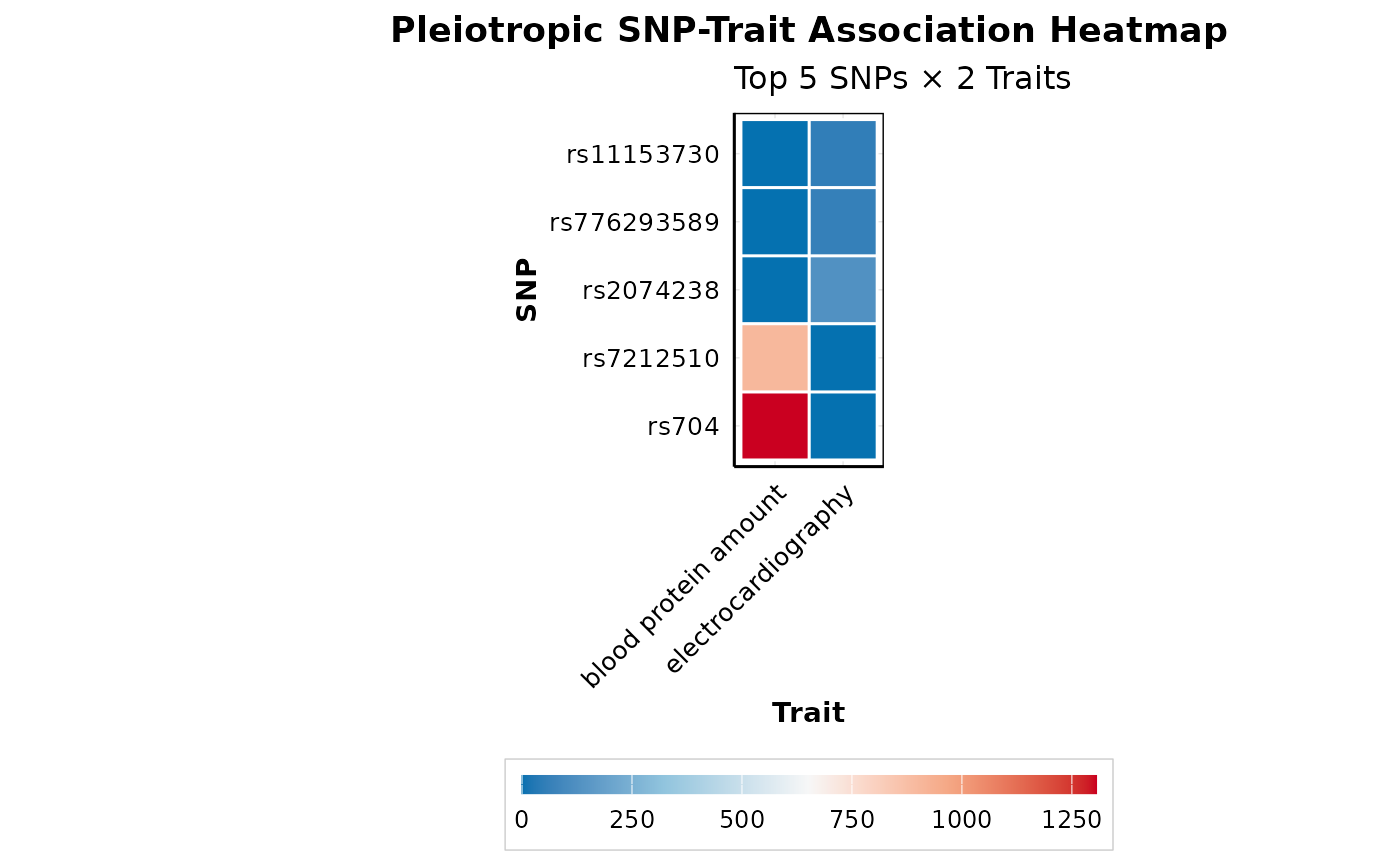
plot_pleiotropy_heatmap.RdCreates a publication-ready heatmap showing -log10(p-value) associations between pleiotropic SNPs and traits. Useful for visualizing patterns of shared genetics.
Usage
plot_pleiotropy_heatmap(
  pleio_data,
  top_n_snps = 20,
  top_n_traits = 10,
  value_col = "PVALUE_MLOG",
  show_dendrograms = FALSE,
  clustering_method = "complete",
  color_palette = "bluered",
  scale = "none",
  show_values = FALSE,
  value_format = NULL,
  legend_title = NULL
)
Arguments
- pleio_data
A data.frame containing pleiotropy analysis results
- top_n_snps
Integer. Number of top pleiotropic SNPs to include (default: 20)
- top_n_traits
Integer. Number of top traits to include (default: 10)
- value_col
Character. Column to use for heatmap values (default: "PVALUE_MLOG")
- show_dendrograms
Logical. Show row and column dendrograms (default: FALSE)
- clustering_method
Character. Clustering method: "complete", "average", "ward.D2" (default: "complete")
- color_palette
Character. Color palette: "bluered", "viridis", "plasma", "default" (default: "bluered")
- scale
Character. Scale values: "none", "row", "column" (default: "none")
- show_values
Logical. Show numeric values in cells (default: FALSE)
- value_format
Character. Format string for values (default: NULL)
- legend_title
Character. Legend title (default: NULL)
Examples
data(gwas_subset)
pleio_results <- detect_pleiotropy(gwas_subset)
if (nrow(pleio_results) > 0) {
    p <- plot_pleiotropy_heatmap(pleio_results, top_n_snps = 5, top_n_traits = 4)
    print(p)
}