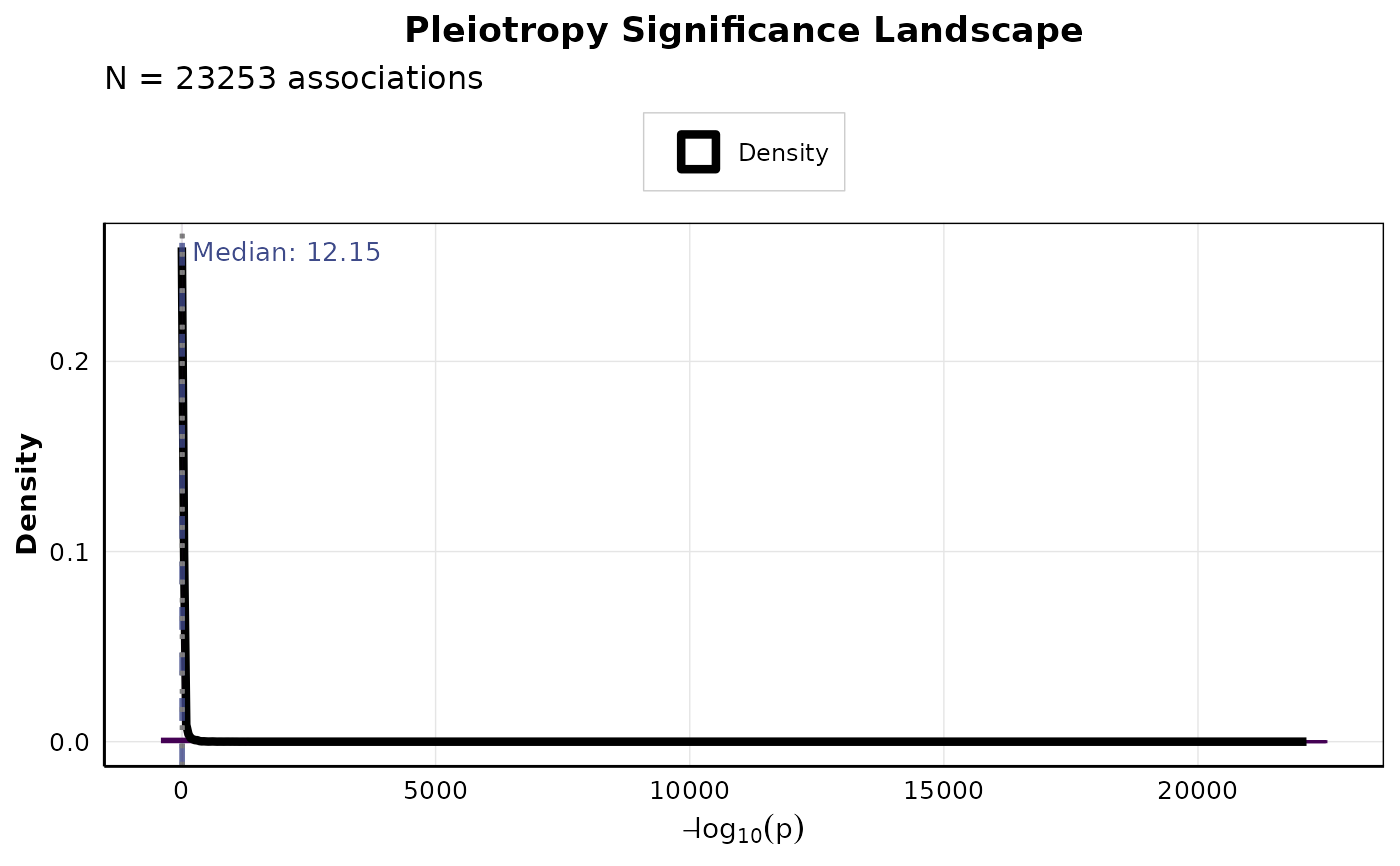
Creates a cumulative distribution plot showing the significance landscape of pleiotropic associations. Helps understand the distribution of significance across all pleiotropic SNPs.
Usage
plot_pleiotropy_landscape(
  pleio_data,
  n_bins = 30,
  show_median = TRUE,
  show_mean = FALSE,
  show_quantiles = TRUE,
  color_palette = "viridis"
)
Arguments
- pleio_data
A data.frame containing pleiotropy analysis results
- n_bins
Integer. Number of bins for histogram (default: 30)
- show_median
Logical. Show median line (default: TRUE)
- show_mean
Logical. Show mean line (default: FALSE)
- show_quantiles
Logical. Show 25th and 75th percentiles (default: TRUE)
- color_palette
Character. Color palette (default: "viridis")
Examples
data(gwas_subset)
pleio_results <- detect_pleiotropy(gwas_subset)
if (nrow(pleio_results) > 0) {
    p <- plot_pleiotropy_landscape(pleio_results)
    print(p)
}