Create Manhattan Plot for Pleiotropic SNPs
Source:R/plot_pleiotropy_manhattan.R
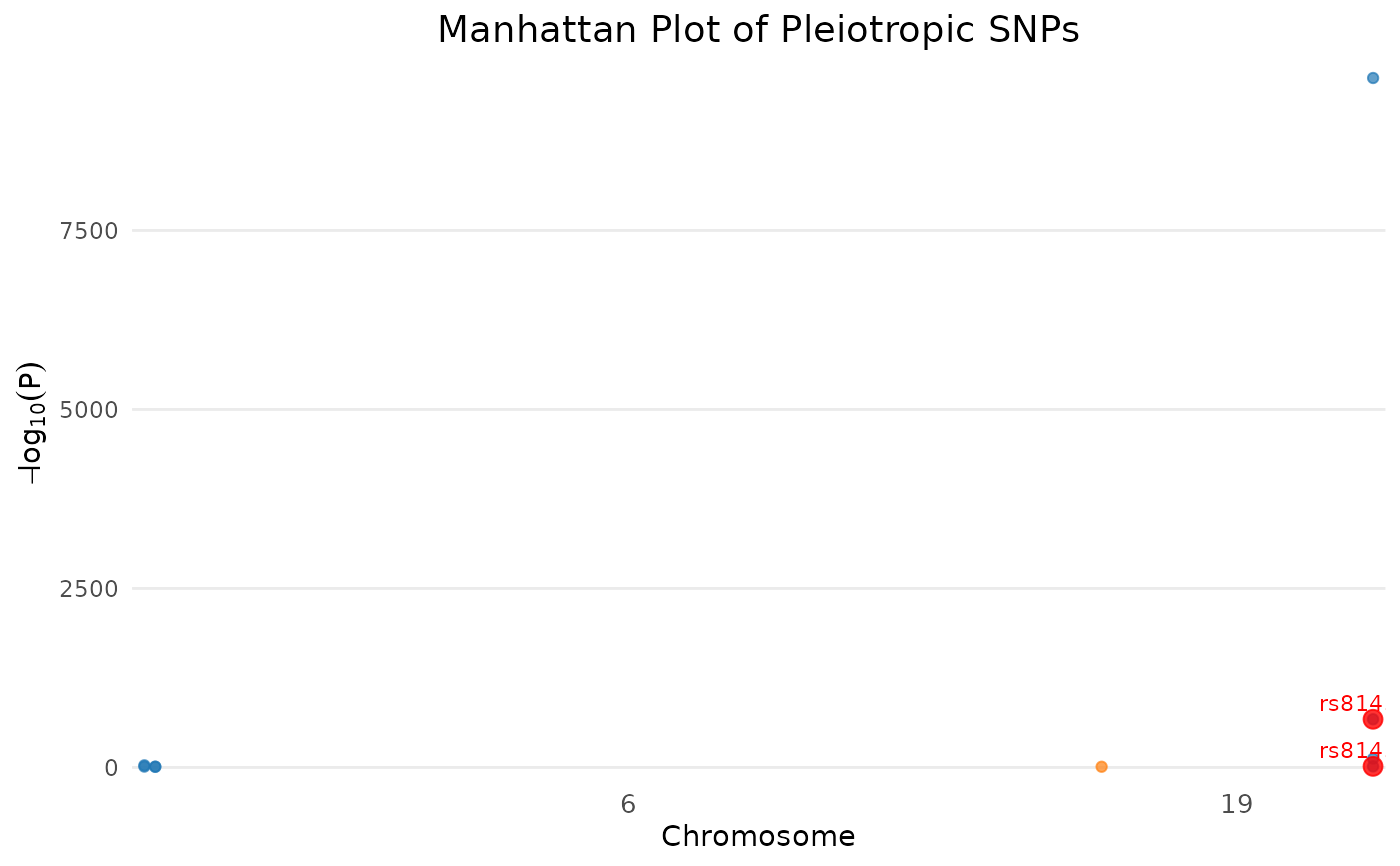
plot_pleiotropy_manhattan.RdGenerates a Manhattan plot highlighting pleiotropic SNPs across chromosomes. The plot shows the distribution of significant associations and can highlight specific SNPs of interest.
Usage
plot_pleiotropy_manhattan(
  pleio_data,
  highlight_snp = NULL,
  title = "Manhattan Plot of Pleiotropic SNPs"
)Examples
data(gwas_subset)
pleio_results <- detect_pleiotropy(gwas_subset)
if (nrow(pleio_results) > 0) {
    p <- plot_pleiotropy_manhattan(pleio_results, highlight_snp = "rs814573")
    print(p)
}
#> Warning: There were 2 warnings in `mutate()`.
#> The first warning was:
#> ℹ In argument: `CHR_POS = as.numeric(CHR_POS)`.
#> Caused by warning:
#> ! NAs introduced by coercion
#> ℹ Run `dplyr::last_dplyr_warnings()` to see the 1 remaining warning.