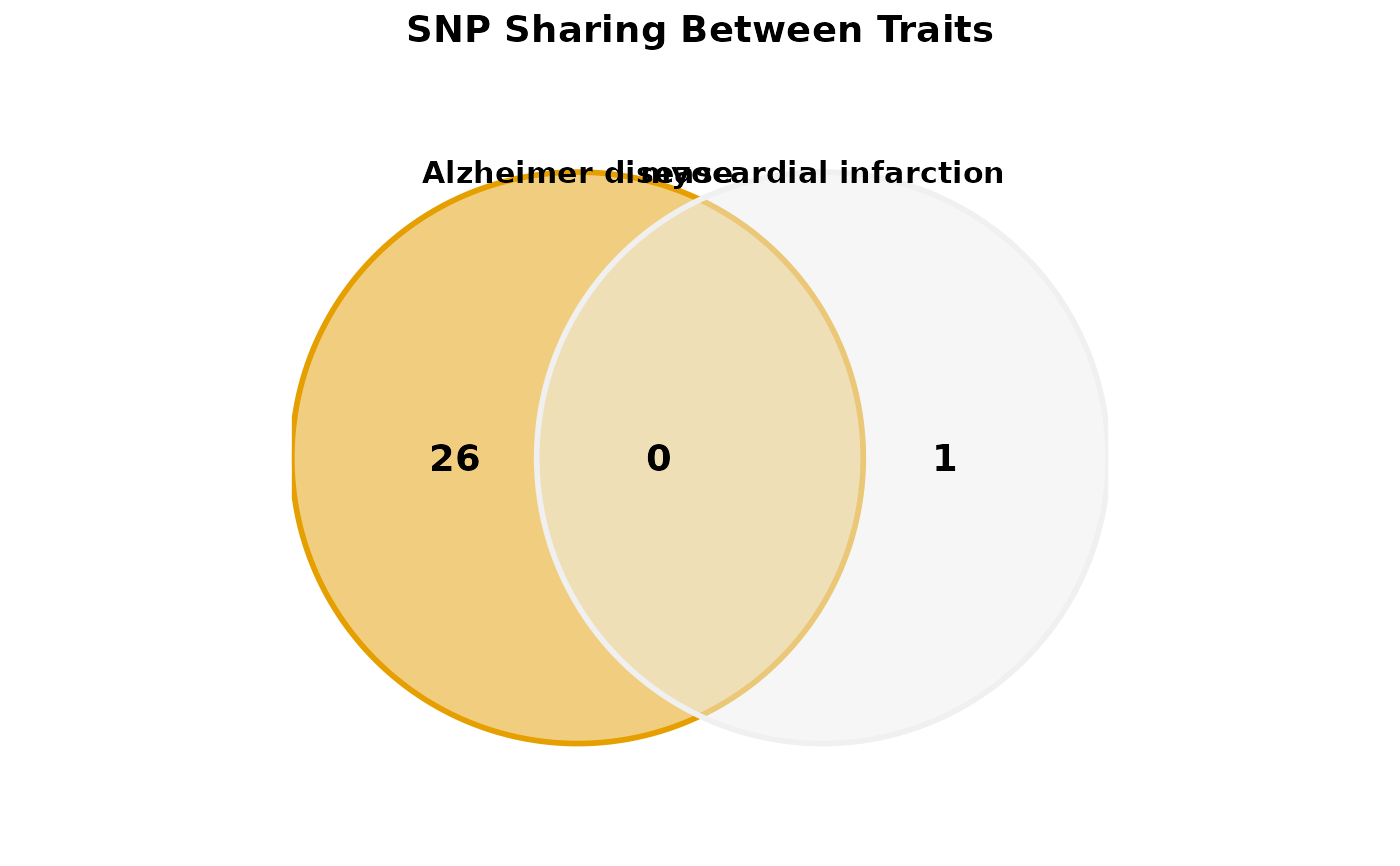
Creates Venn diagrams showing overlap of pleiotropic SNPs between 2-4 traits. Helps visualize shared genetic architecture across phenotypes.
Usage
plot_venn_diagram(
  pleio_data,
  traits,
  title = "SNP Sharing Between Traits",
  show_counts = TRUE,
  show_percentages = FALSE,
  color_palette = "okabe_ito",
  alpha = 0.5
)
Arguments
- pleio_data
A data.frame containing pleiotropy analysis results
- traits
Character vector. 2-4 traits to compare (required)
- title
Character. Plot title (default: "SNP Sharing Between Traits")
- show_counts
Logical. Show counts in each region (default: TRUE)
- show_percentages
Logical. Show percentages (default: FALSE)
- color_palette
Character. Color palette: "okabe_ito", "viridis", "default" (default: "okabe_ito")
- alpha
Numeric. Transparency (default: 0.5)
Examples
data(gwas_subset)
pleio_results <- detect_pleiotropy(gwas_subset)
if (nrow(pleio_results) > 0) {
    p <- plot_venn_diagram(pleio_results,
        traits = c("Alzheimer disease", "myocardial infarction")
    )
    print(p)
}