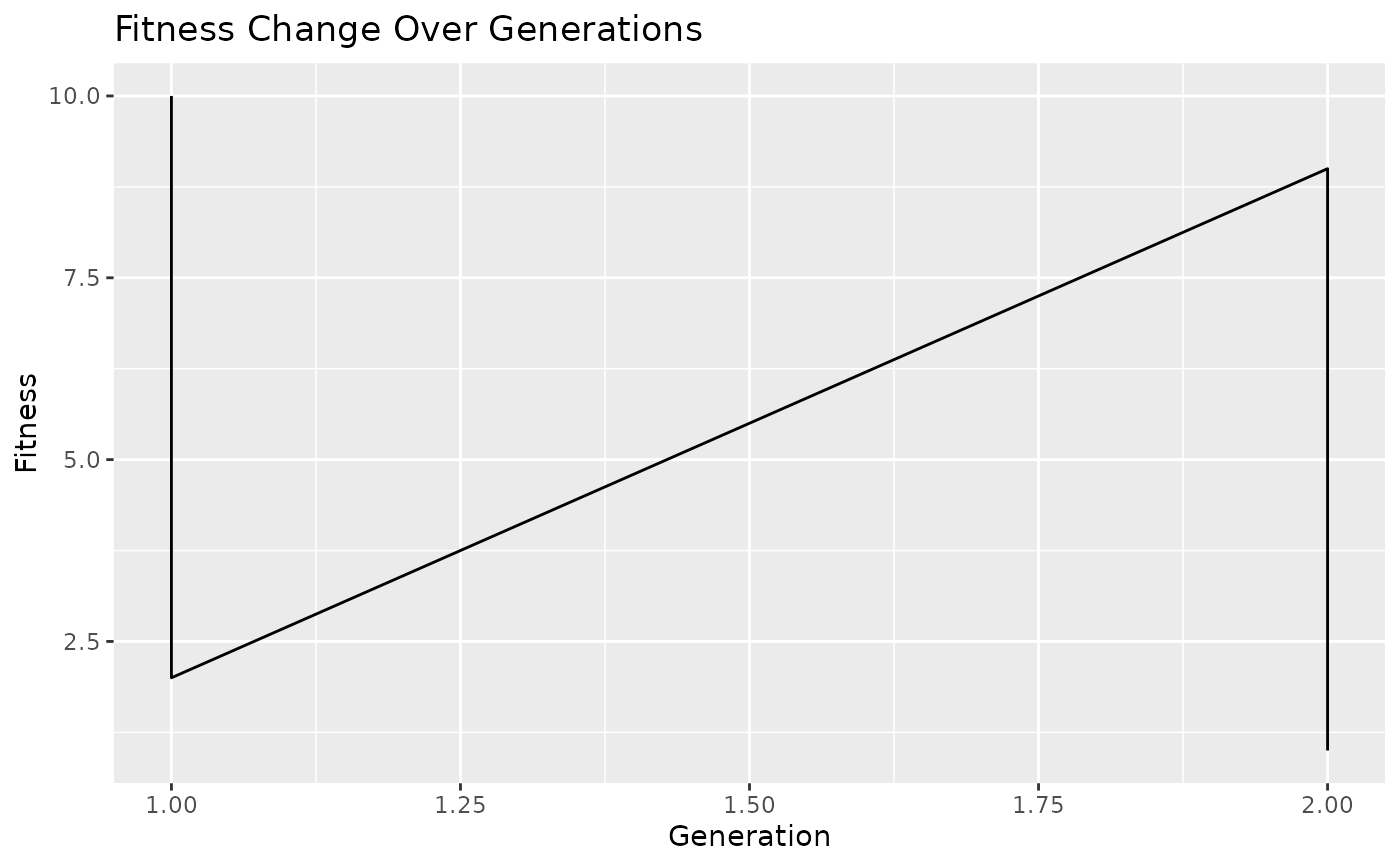
Plot the change in fitness values over generations.
Usage
plot_fitness_history(fitness_history)
Arguments
- fitness_history
A list containing fitness values for
each generation.
Value
Plot of fitness history
Examples
# example of usage
fitness_history <- list(c(10, 8, 6, 4, 2), c(9, 7, 5, 3, 1))
plot_fitness_history(fitness_history)