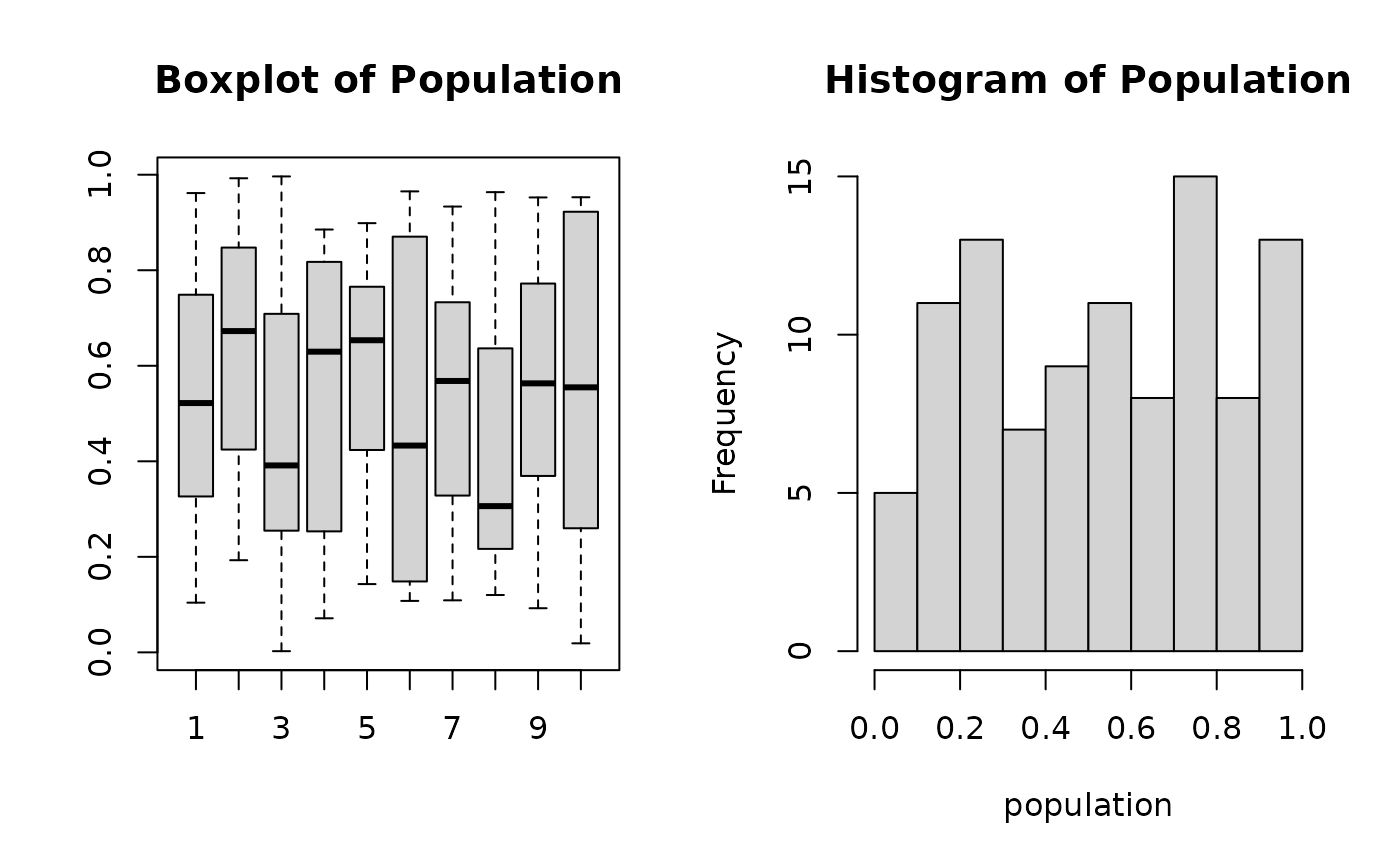
Plot the distribution of individuals in the population.
Usage
plot_population(population)
Arguments
- population
A numeric matrix containing the population data.
Examples
# example of usage
population <- matrix(runif(100), nrow = 10, ncol = 10)
plot_population(population)